

Relying on end of month closed revenue to judge company health is like navigating a motorway by looking solely in your rearview mirror. By the time missed targets show up in your accounting software, the damage was done months earlier. High performing B2B organisations across SaaS, tech, recruitment, and manufacturing have abandoned rear facing reports. Instead, elite teams rely on pipeline metrics that predict revenue growth to gain real time visibility into future ARR.
When you track leading indicators rather than lagging outputs, revenue generation transforms from a stressful guessing game into an engineered science. By combining advanced RevOps metrics with real time B2B pipeline velocity monitoring and buyer intent data, you spot coverage gaps early, fix conversion leaks, and scale your business with absolute certainty.
1. B2B Pipeline Velocity & Essential Pipeline Metrics That Predict Revenue Growth
Pipeline velocity measures the exact speed at which prospective buyers travel through your sales funnel into closed revenue. Calculated by multiplying active qualified deals by your win rate and average deal size, then dividing by sales cycle length, it serves as the single most reliable health indicator for future B2B financial growth.
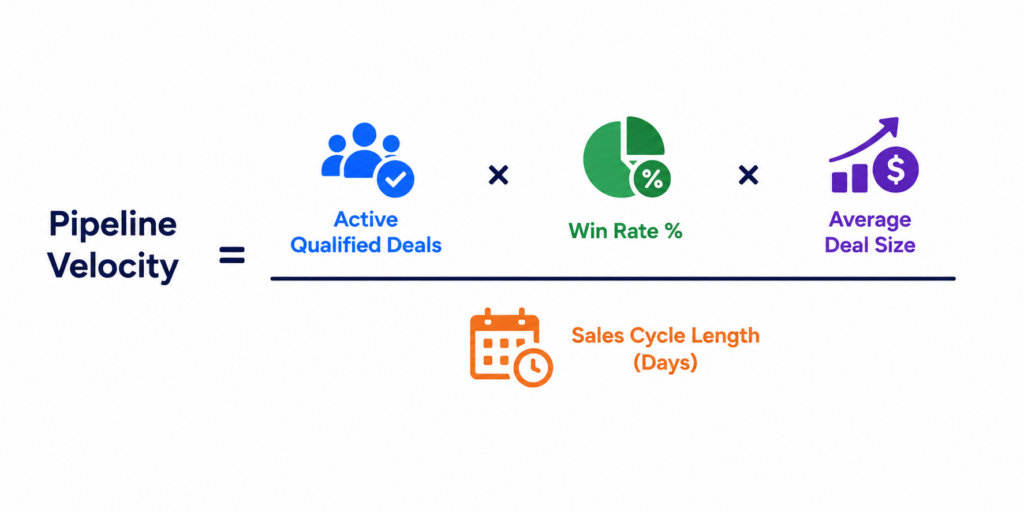
Pipeline velocity reveals how efficiently your commercial engine converts sales activity into cash. If any single variable in this formula fluctuates, your overall revenue trajectory alters instantly.
Core Operational Mechanics & Sales Cycle Optimisation
- Accelerate velocity with buyer intent data: Identifying warm accounts reading your high intent web pages allows sales reps to intervene early, slicing weeks off the standard sales cycle optimisation process.
- Maintain strict pipeline hygiene: Purge stagnant opportunities aggressively. Inflated deal counts artificially inflate your velocity calculations and distort revenue forecasts.
- Optimise deal size over deal volume: Closing five high value enterprise accounts often yields higher pipeline velocity than chasing fifty small contracts that drag down account executive bandwidth.
2. Stage Lead Conversion Rate: Locating Hidden Funnel Leaks
Stage conversion rates measure the percentage of prospective accounts that successfully transition from one sales milestone to the next. Tracking your lead conversion rate across micro conversions reveals structural bottlenecks, rep performance issues, and alignment friction between marketing and sales teams before revenue targets are compromised.
To build an accurate revenue model, you must measure every step of the buyer journey. A drop in conversion between initial website discovery and booked demo signals weak value messaging, while a collapse between proposal and close points to pricing friction or poor economic buyer engagement
Website Visitor Identification & Key Areas to Monitor
- Visitor to SQL conversion: Evaluate how efficiently anonymous traffic converts into sales opportunities. Integrating website visitor identification software helps capture high value accounts visiting your site without submitting forms.
- SQL to Proposal conversion: High friction here indicates poor discovery calls or a mismatch between buyer expectations and your core solution offerings.
- Proposal to Closed Won ratio: A falling close rate suggests sales teams are delivering quotes to unquantified buyers who lack purchasing authority.
3. Sales Pipeline Coverage Ratio: Securing Future Targets
The sales pipeline coverage ratio compares your total active pipeline value against your stated revenue target for a specific timeframe. Maintaining a healthy coverage ratio ensures your sales force has enough pipeline depth to hit revenue targets despite unexpected deal slippage or longer purchasing cycles.
Most B2B leadership teams default to an arbitrary four times pipeline coverage rule. However, relying on fixed metrics without accounting for win rate variations creates false security.
Building an Accurate Coverage Framework using RevOps Metrics
- Calculate coverage based on historical win rates: If your team historically closes twenty five percent of qualified deals, you require a strict four times coverage ratio. If your win rate is forty percent, a two and a half times coverage ratio is sufficient.
- Filter out unvalidated pipeline: Ensure pipeline coverage calculations include only vetted accounts meeting strict qualification criteria, such as verified budget, authority, need, and timeline.
- Monitor coverage by deal tier: Segment pipeline metrics by target account size to prevent a few oversized enterprise deals from masking a shortage of mid market opportunities.
4. Sales SLA Speed to Lead: Capitalising on Buyer Intent Data & B2B Sales Intelligence
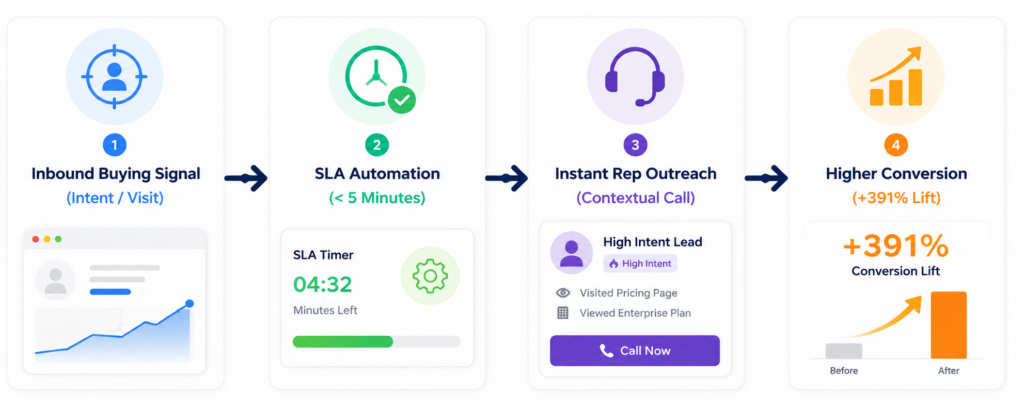
Sales SLA speed to lead tracks the precise time elapsed between a prospective buyer showing intent and a sales rep initiating personalised outreach. Leveraging buyer intent data and B2B sales intelligence to contact high intent prospects within minutes drastically increases contact rates, demo bookings, and closed won opportunity conversion.
The modern B2B purchasing journey happens quickly. By the time a decision maker submits an enquiry on your site, they are usually evaluating your competitors simultaneously.
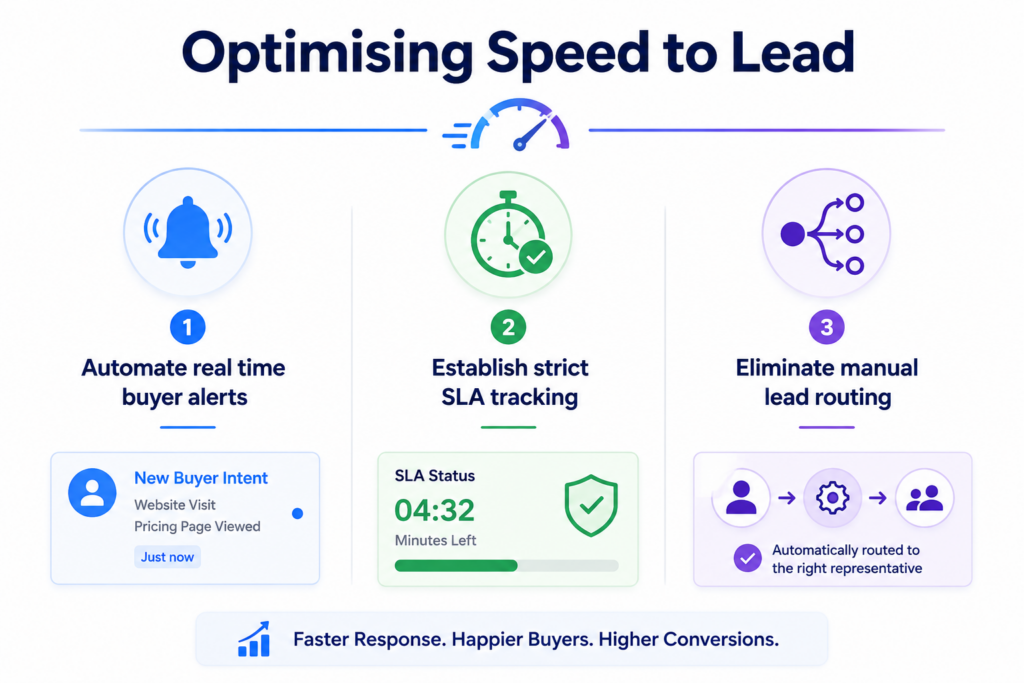
Optimising Speed to Lead
- Automate real time buyer alerts: Push intent notifications straight to account executives via desktop tools or CRM alerts the moment a target company visits your pricing page.
- Establish strict SLA tracking: Set binding internal agreements requiring inbound high intent leads to receive a call or tailored message within five minutes.
- Eliminate manual lead routing: Use dynamic lead routing rules to assign incoming buyer profiles directly to the correct sector specialist instantly.
Frequently Asked Questions
What are the most vital pipeline metrics that predict revenue growth?
The top predictive pipeline metrics that predict revenue growth are B2B pipeline velocity, stage conversion rates, qualified sales pipeline coverage ratio, and sales SLA speed to lead. Tracking these RevOps metrics provides early indicators of future ARR, enabling teams to adjust sales strategies long before quarterly revenue reports are finalised.
How do you calculate B2B pipeline velocity accurately?
B2B pipeline velocity is calculated by multiplying active qualified opportunities by your win rate percentage and average deal size, then dividing that figure by your average sales cycle length in days. This formula yields the daily value moving through your commercial pipeline.
Why is buyer intent data critical for sales pipeline prediction?
Buyer intent data reveals hidden demand by pinpointing companies actively researching your products online before they submit a form. Capturing this intent allows sales teams to engage prospects earlier, leading to higher lead conversion rate results, effective sales cycle optimisation, and more accurate revenue forecasting.
What is a healthy pipeline coverage ratio for B2B SaaS?
A healthy sales pipeline coverage ratio typically ranges between three times and five times your target quota. The exact ideal ratio depends heavily on your team's historical win rate, average sales cycle duration, and contract value stability.
Conclusion
Mastering pipeline metrics that predict revenue growth transforms commercial operations from reactive target chasing into a predictable, scalable process. By measuring B2B pipeline velocity, lead conversion rate benchmarks, qualified sales pipeline coverage ratios, and buyer intent data response times, you gain full control over your future revenue trajectory.
Tracking these forward looking metrics requires complete visibility into your prospective buyers. Deploying website visitor identification powered by B2B sales intelligence to capture high intent buying signals gives your sales team the exact context needed to close deals faster.
Ready to fill your pipeline with high intent B2B buyers? Book a demo with Dynamic Leads today and turn anonymous website traffic into predictable revenue growth.