Scaling a B2B business without tracking core unit economics is a guaranteed recipe for burning capital. In fast moving growth sectors, maintaining long term profitability requires an explicit balance between what you spend to win an account and the total net revenue that account yields. When evaluating cac vs ltv, commercial leaders gain absolute visibility over unit health, operational cash flow, and GTM resource allocation.
What Are CAC and LTV?
Before looking at the combined metric, it helps to understand each side of the equation individually:
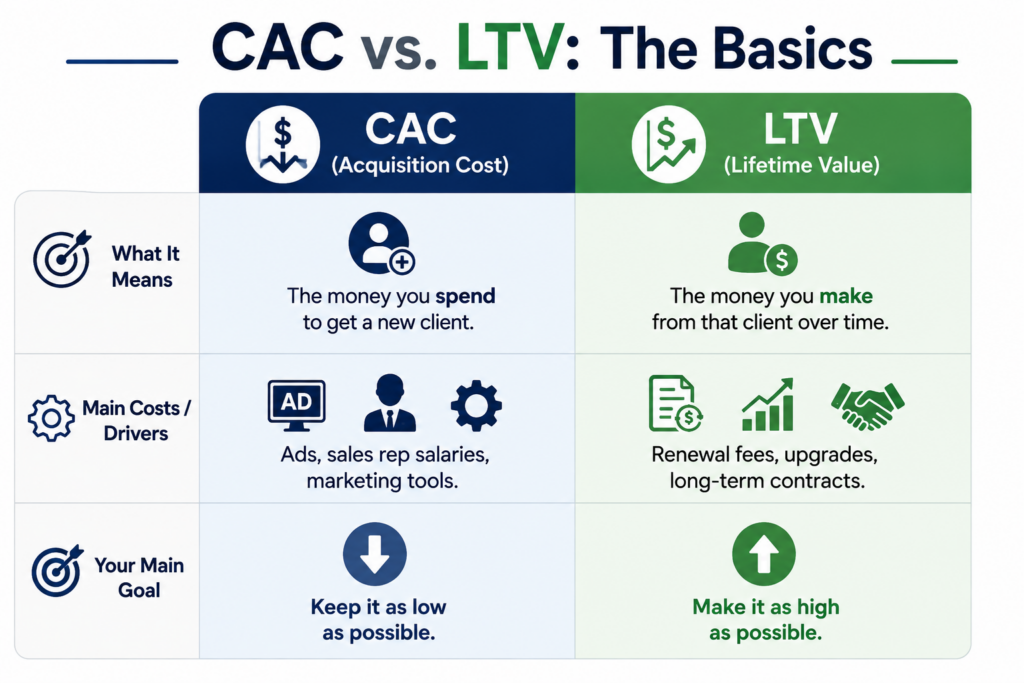
- CAC (Customer Acquisition Cost): The total financial expense required to win a single new customer. This includes all marketing spend, sales salaries and commissions, advertising overhead, software tools, and onboarding resources spent during a specific timeframe divided by the number of accounts acquired.
- LTV (Lifetime Value): The total net gross margin or revenue a single customer account generates across the entire duration of their relationship with your business. It accounts for recurring subscription or contract fees, upsells, cross-sells, and account expansion, minus direct servicing costs and churn.
If your customer acquisition cost continually increases while customer lifetime value stalls, your expansion strategy will fail. By mastering cac vs ltv, aligning sales with active buyer intent signals, and streamlining your pipeline, you transform wasteful outbound spending into predictable, compounding revenue.
What Is CAC vs LTV and Why It Essential for Driving B2B Unit Economics?
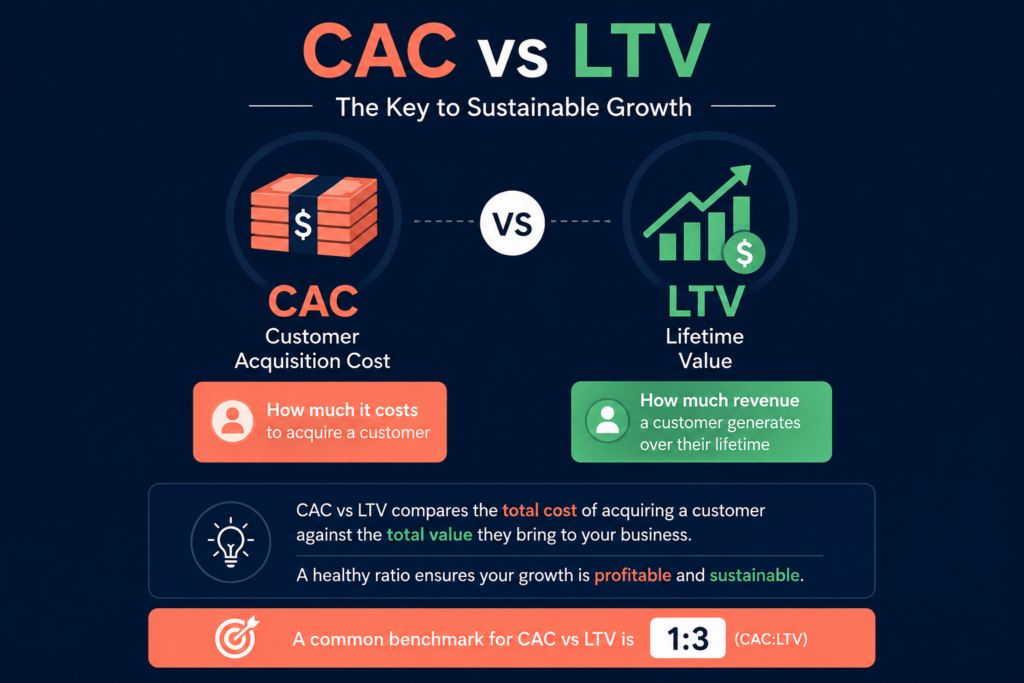
CAC vs LTV compares total acquisition costs against total lifetime revenue generated by an individual account. This essential ratio serves as the primary diagnostic for commercial viability, determining whether your sales pipeline, RevOps strategy, and pricing models yield sustainable profit margins over time.
Comparing cac vs ltv allows B2B service providers, SaaS platforms, and agencies to measure ROI across specific client segments. Customer Acquisition Cost incorporates marketing spend, sales overheads, software subscriptions, and commission structures. Customer Lifetime Value measures retained gross margin over the entire account lifecycle.
Analyzing these metrics together prevents teams from overinvesting in low margin accounts. If acquisition expenses exceed net retention value, expansion efforts drain capital. Integrating real time buyer tracking ensures your sales force targets high value accounts ready to buy today, maximizing commercial efficiency.
Benchmarking the Essential CAC to LTV Ratio for B2B Success
The standard benchmark for a healthy B2B CAC to LTV ratio is 1:3. This ratio confirms that for every £1 spent on sales and marketing, your company secures £3 in lifetime value, leaving ample margin for operational overhead, product innovation, and business scaling.
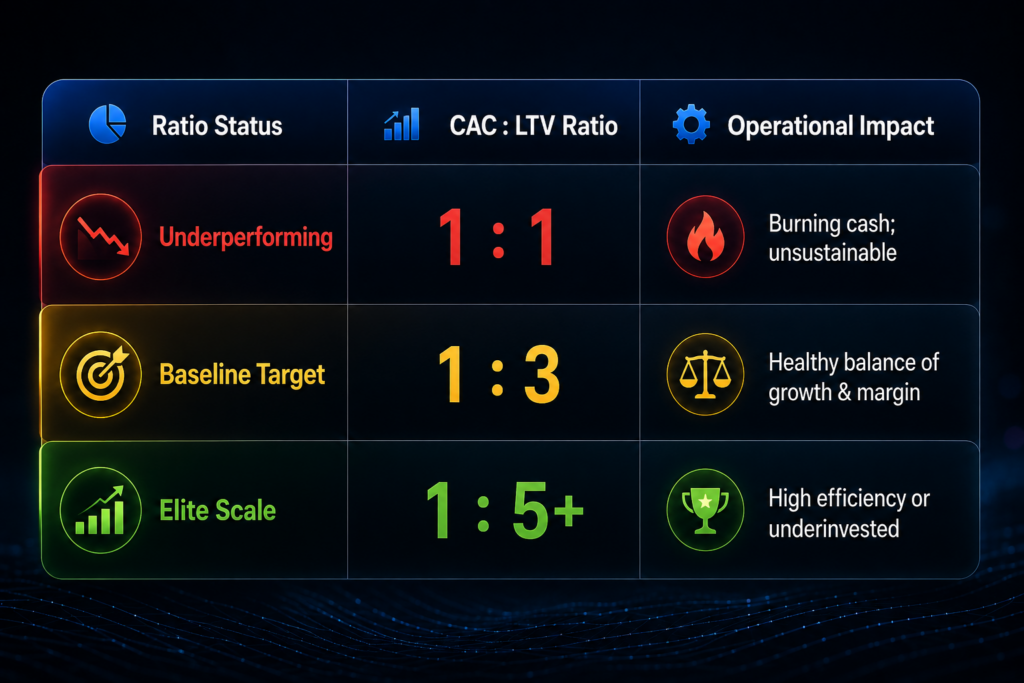
A 1:1 ratio indicates your business breaks even on direct sales, leaving zero margin to support operational delivery or product updates. Conversely, a ratio higher than 1:5 suggests you are underinvesting in marketing and leaving valuable market share open to competitors.
In tandem with this ratio, tracking your CAC payback period is vital. Ideal B2B payback periods range between 8 and 12 months. Shortening your payback period frees up critical working capital, allowing your business to reinvest in acquisition channels with total confidence.
Strategies to Optimise CAC and Boost LTV with Intent Data
Lowering acquisition expenses while expanding lifetime value requires engaging prospective buyers at peak buying intent. Identifying anonymous website visitors early removes wasted ad spend, focuses sales teams on warm leads, and dramatically accelerates overall sales pipeline velocity.
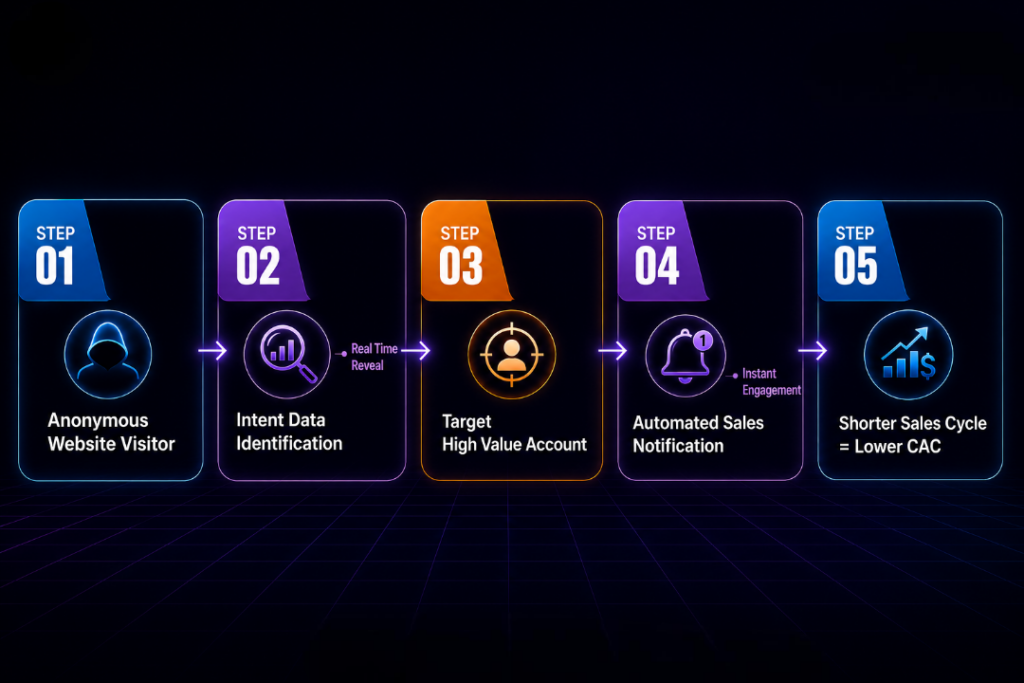
To optimize acquisition costs and maximize account value, focus on these three execution pillars:
- Capture First Party Intent Data: Stop wasting ad budget by identifying anonymous enterprise visitors on your site and revealing their business profile instantly.
- Align Marketing and RevOps: Feed active buyer intent signals into your CRM so reps can contact decision makers while they research solutions.
- Focus on Post Onboarding Retention: Protect lifetime value by using product usage signals to identify expansion opportunities and prevent churn early.
Deploying automated visitor identification ensures your sales team spends time engaging warm prospects rather than chasing cold contact lists.
Frequently Asked Questions
What is a good CAC vs Customer Lifetime Value (LTV) ratio for B2B SaaS?
A target ratio for B2B SaaS is 1:3 or higher. This benchmark guarantees that customer lifetime value comfortably covers acquisition expenses, customer success costs, and gross profit margins. Ratios under 1:3 indicate inefficient acquisition channels or high churn rates.
How does buyer intent data lower customer acquisition cost?
Buyer intent data identifies anonymous accounts actively visiting your website. By focusing outreach exclusively on accounts displaying warm buying behavior, sales teams shorten deal cycles, lower advertising waste, raise conversion rates, and reduce overall acquisition expenses.
How long should a B2B CAC payback period take?
An optimal B2B CAC payback period takes between 8 and 12 months. Recovering acquisition costs within a year protects working capital, lowers financial risk, and enables your business to safely scale marketing spend.
How does a unified RevOps strategy improve CAC vs LTV efficiency?
A unified RevOps strategy connects marketing, sales, and customer success data into a single operational workflow. By eliminating departmental silos, RevOps streamlines lead handoffs, automates account scoring, reduces sales friction, and lowers overall acquisition expenses while expanding long-term account retention.
Conclusion
Understanding the dynamic of cac vs ltv is not just a theoretical exercise; it is the cornerstone of sustainable B2B profitability. By keeping acquisition costs tight and systematically expanding account value, you construct a resilient, high margin growth engine. Stop wasting budget on cold outreach campaigns that inflate costs without generating qualified pipeline opportunities.
Ready to transform your unit economics? Dynamic Leads transforms anonymous website traffic into actionable, high intent sales opportunities in real time, shortening sales cycles and reducing acquisition costs.
Book a Demo with Dynamic Leads Today to access real time buyer insights and maximize your pipeline profitability.